Visualizing airspace usage by glider aircraft
In the past year I have done a significant amount of work to process flight information from glider aircraft. For reference, in 2017 I have processed about 1,000,000,000 position updates and at the end of the year I had a database which stored about 700,000,000 data points, which represented over 30,000 unique aircraft. One data point contains information like latitude, longitude, altitude, speed, heading, climb-rate and turn-rate.
Funny thing; the difference between the amount of processed points and stored points came from beginning of the year, when I accidentally deleted the database, containing 300,000,000 data points, during a migration. Oooops. Should’ve made proper back-ups!
A while ago I decided to export just a little bit of data to look into in detail. The data export contained all data from Sunday 13th of August, 2017, on which the 19th edition of the FAI European Gliding Championships has been held from Lasham Airfield.
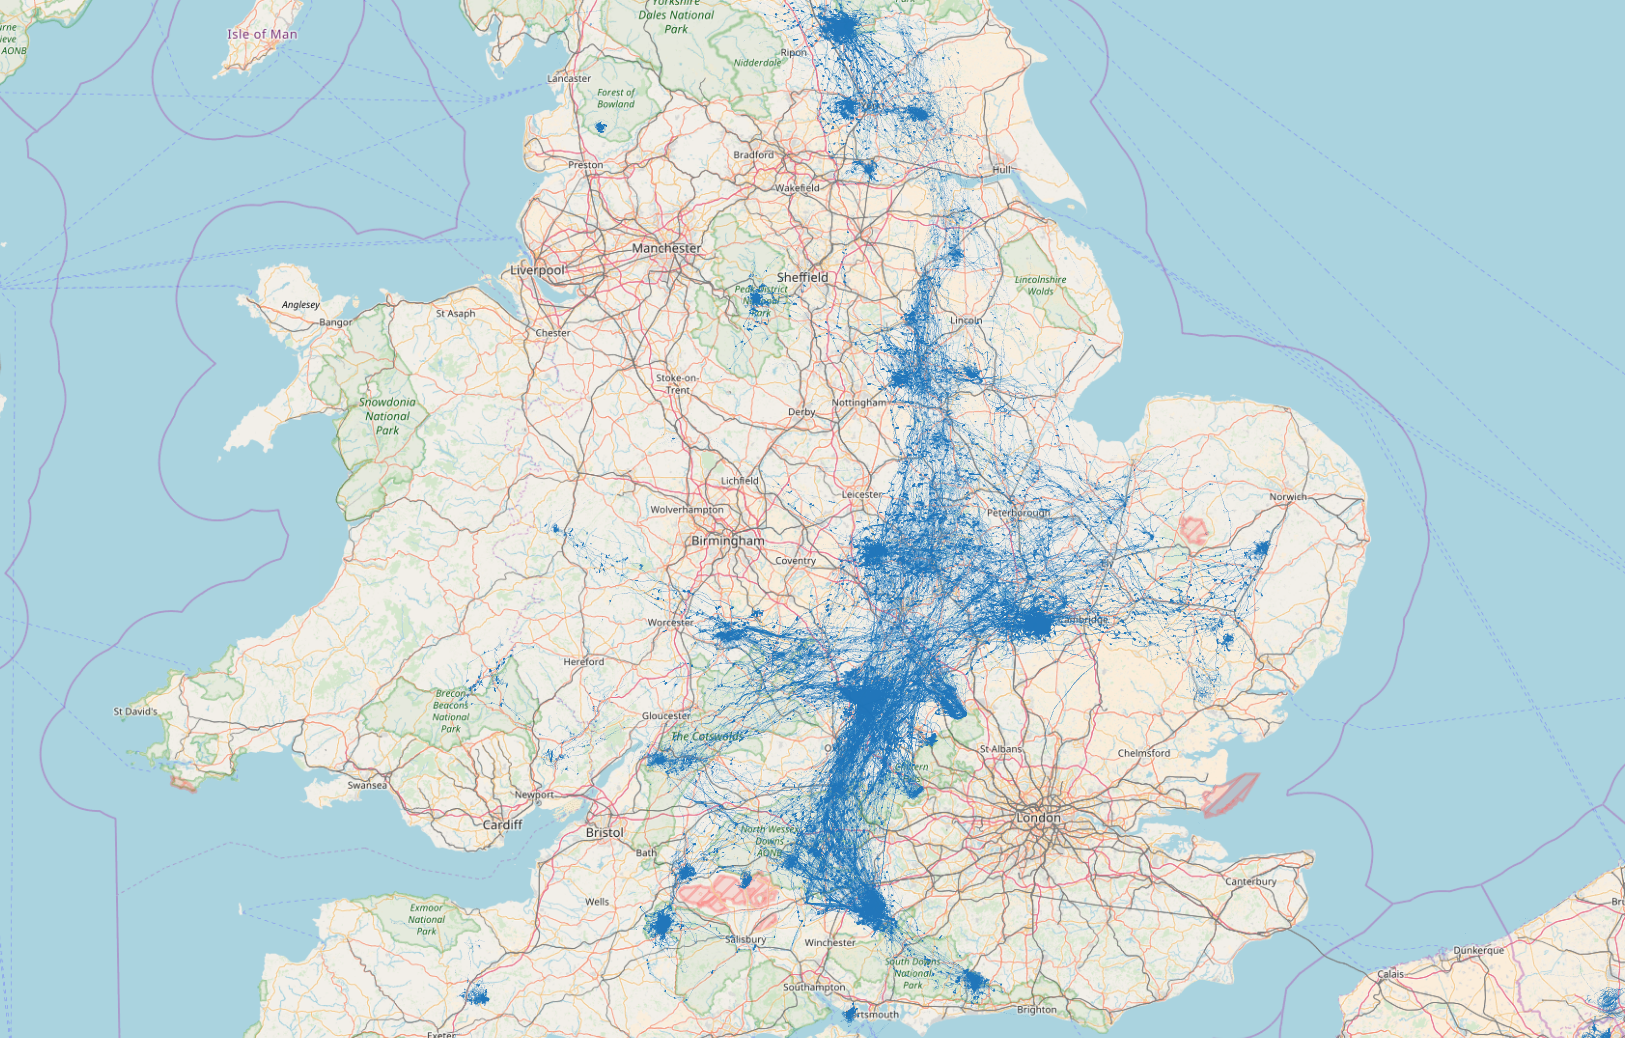
To get an idea of the sheer size of the event, check out the video from the British Gliding Team above. In order to get an idea of the glider activity, on this day alone, check the image below.

Please note that on this day alone about 14,000,000 position update have been recorded. Considering an aircraft sends out an position update about once a second that means a little less then 4000 hours of flight activity has been recorded, on this day alone.
I managed to create a quick visualization of gliders coming back to Lasham airfield starting at around 15:30Z. See below!
The things I’m displaying here represent only a small portion of the work which has been done, and an even smaller portion of the full potential of this data in combination with the right tooling. Although this by far isn’t the end result I’m wanting to achieve I’m already quite proud on this humble result! More and better stuff will definitely follow in the future! Stay tuned for further updates! :)