Contents ▾
C# Debugging Tools in Visual Studio
The complexity of Visual Studio is such that even after about a decade of near-daily use I still get to discover new functionality every now and then. In this post some debugging tips and tricks on the effective use of the tool. While this one focuses on Visual Studio, most of these tools are available in JetBrains’ Rider IDE as well.
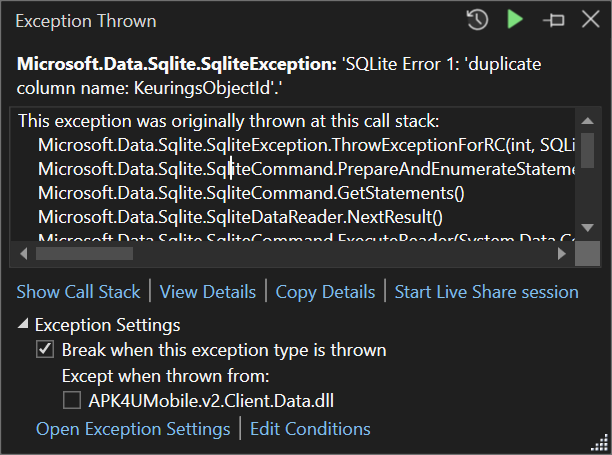
For sake of an example I’ll go down into the specifics required to trace down a Microsoft.Data.Sqlite.SqliteException with the message “SQLite Error 1: ‘duplicate column name: KeuringsObjectId’.”. The difficulty of this exception is that it originates from an external library, but is dependent on some application-specific configuration. While the exception shows some information (the column name) the information is too generic to pinpoint a specific issue.
Pre-configuration
For a good development experience it should be noted that I have enabled the debugger to break on all CLR exceptions from the Exception Settings window (Debug -> Windows -> Exception Settings -> Common Language Runtime Exceptions). Depending on the coding hygiene excercised by the development team it might or might not impact your general debugging workflow.
Another useful configuration option on the debugger is “Just My Code”. While generally enabled, I tend to disable it in situations where I have to debug obscure errors originating from some external opaque framework (Tools -> Options -> Debugging -> General -> Enable Just My Code).
The Call Stack
When debugging C# code the callstack is perhaps one of the most important aspects. It contains all function invocations up until the point a certain exception is thrown. It allows one to follow the execution flow of the program up until the point of the problematic statement(s). This alone might already be enough to identify the root cause of the error. There are a number of different ways to access the call stack. It is shown in the exception message, can be accessed from the exception data structure, if at hand, or it can be accessed from the call stack window in Visual Studio (Debug -> Windows -> Call Stack, or the “Show Call Stack” from the exception plate).
The call stack itself is perhaps the most powerful tool in the debugging arsenal as well. Clicking on a specific item in the call stack allows you to navigate to that point in your source files.
Note that the Call Stack Window contains a button “Show External Code”. This one is important if you do not see the origin of your exception. There’s two arrows; a yellow one and a green one. The yellow one is where the debugger is currently paused. The green one is where your locals are currently focused at.
The Locals Window
It should be noted when the “Break on exception” option is enabled, you can also use the locals window to see the values of local variables at that point and time in the call stack. This is a superpower! It feels like we can travel back in time as to investigate the circumstances of the exception.
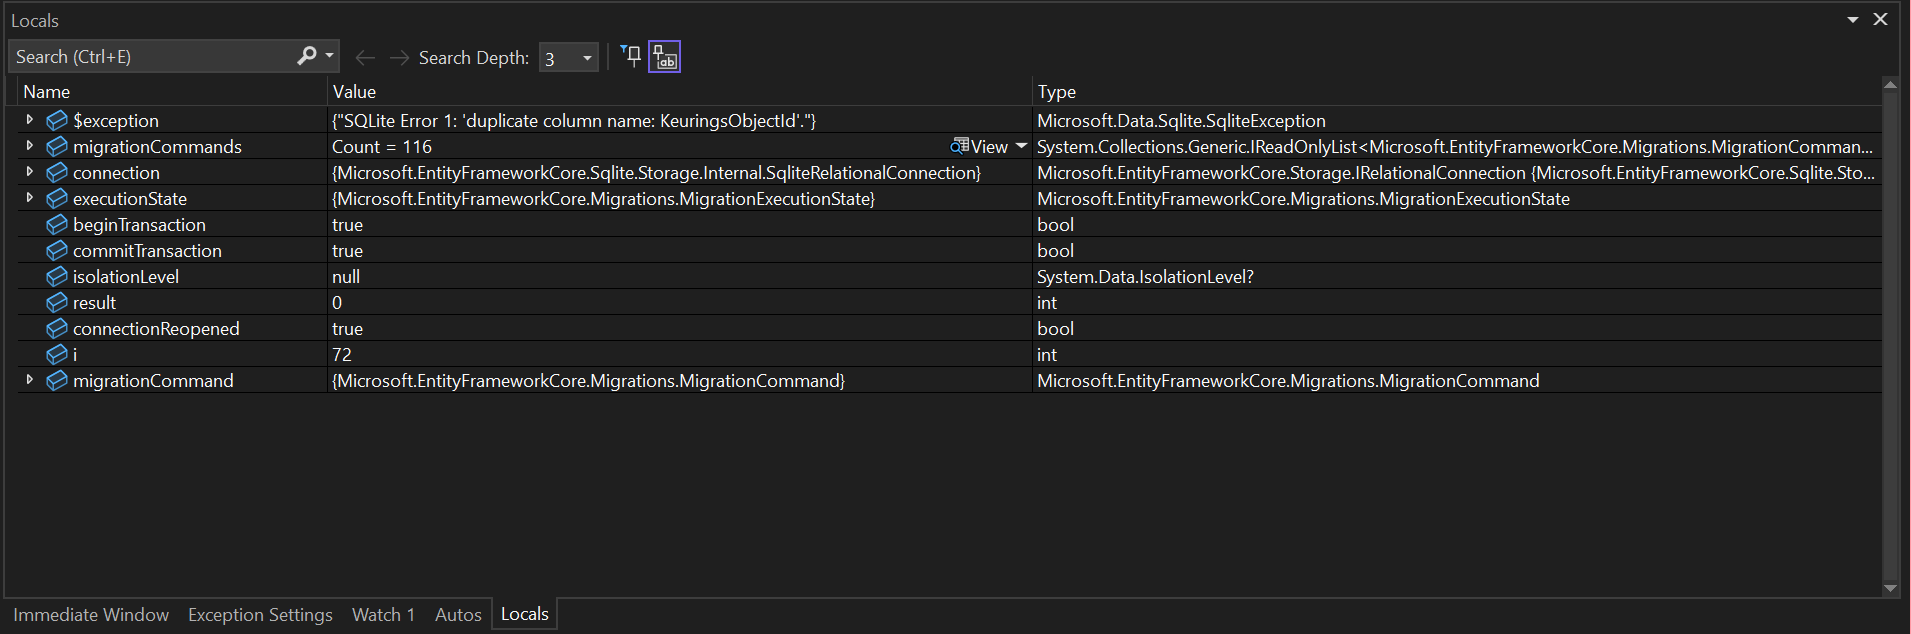
In the locals above two things stand out:
- The
migrationCommandsvariable contains 116 items - The
ivariable holds the position in the for loop iterating over aformentioned list, having a value of 72
This information is incredibly useful for finding the root casue of this exception. One way we can find this error is by opening the list and scrolling to item 72. Another option is the immediate window, discussed hereafter.
The Immediate Window
The Immediate window helps us to evaluate code snippets. It has some autocomplete features to help us access the correct variables, and outputs its value in the console. Entering migrationCommands[i] provides the following result:
migrationCommands[i]
{Microsoft.EntityFrameworkCore.Migrations.MigrationCommand}
    CommandLogger: {Microsoft.EntityFrameworkCore.Diagnostics.Internal.RelationalCommandDiagnosticsLogger}
    CommandText: "CREATE TABLE \"Annotations\" (\r\n    \"id\" TEXT NOT NULL CONSTRAINT \"PK_Annotations\" PRIMARY KEY,\r\n    \"AnnotationId\" TEXT NOT NULL,\r\n    \"X\" INTEGER NOT NULL,\r\n    \"Y\" INTEGER NOT NULL,\r\n    \"AnnotationMapId\" TEXT NOT NULL,\r\n    \"KeuringsobjectId\" TEXT NOT NULL,\r\n    \"KeuringsObjectId\" TEXT NULL,\r\n    \"createdAt\" REAL NULL,\r\n    \"updatedAt\" REAL NULL,\r\n    \"deleted\" INTEGER NULL,\r\n    \"version\" TEXT NULL,\r\n    CONSTRAINT \"FK_Annotations_AnnotationMaps_AnnotationMapId\" FOREIGN KEY (\"AnnotationMapId\") REFERENCES \"AnnotationMaps\" (\"AnnotationMapId\") ON DELETE CASCADE,\r\n    CONSTRAINT \"FK_Annotations_KeuringsObject_KeuringsObjectId\" FOREIGN KEY (\"KeuringsObjectId\") REFERENCES \"KeuringsObject\" (\"id\"),\r\n    CONSTRAINT \"FK_Annotations_KeuringsObject_KeuringsobjectId\" FOREIGN KEY (\"KeuringsobjectId\") REFERENCES \"KeuringsObject\" (\"KeuringsObjectId\") ON DELETE CASCADE\r\n);\r\n"
    TransactionSuppressed: false
    _context: {APK4UMobile.v2.Client.Data.PdaContext}
    _relationalCommand: {Microsoft.EntityFrameworkCore.Storage.RelationalCommand}
This already steers us to a root cause of the failure, and rather than solely the column name we have the full context of the exception, including table names, relationships, and even the raw command that had been executed against the database causing the exception in the first place.
Debugging multithreaded code
Parallellization is a beast of its own, but is supported by its own set of debugging tools. The tools as described before keep working in the same manner, but now there are three other windows helping one navigate the different asynchronous threads:
- Parallel Stacks (Debug -> Windows -> Parallel Stacks)
- Tasks (Debug -> Windows -> Tasks)
- Threads (Debug -> Windows -> Threads)
Parallel Stacks Window
For getting an early overview about what is going on the Parallel Stacks window is generally useful; the bigger the stack is, the more important it might be.
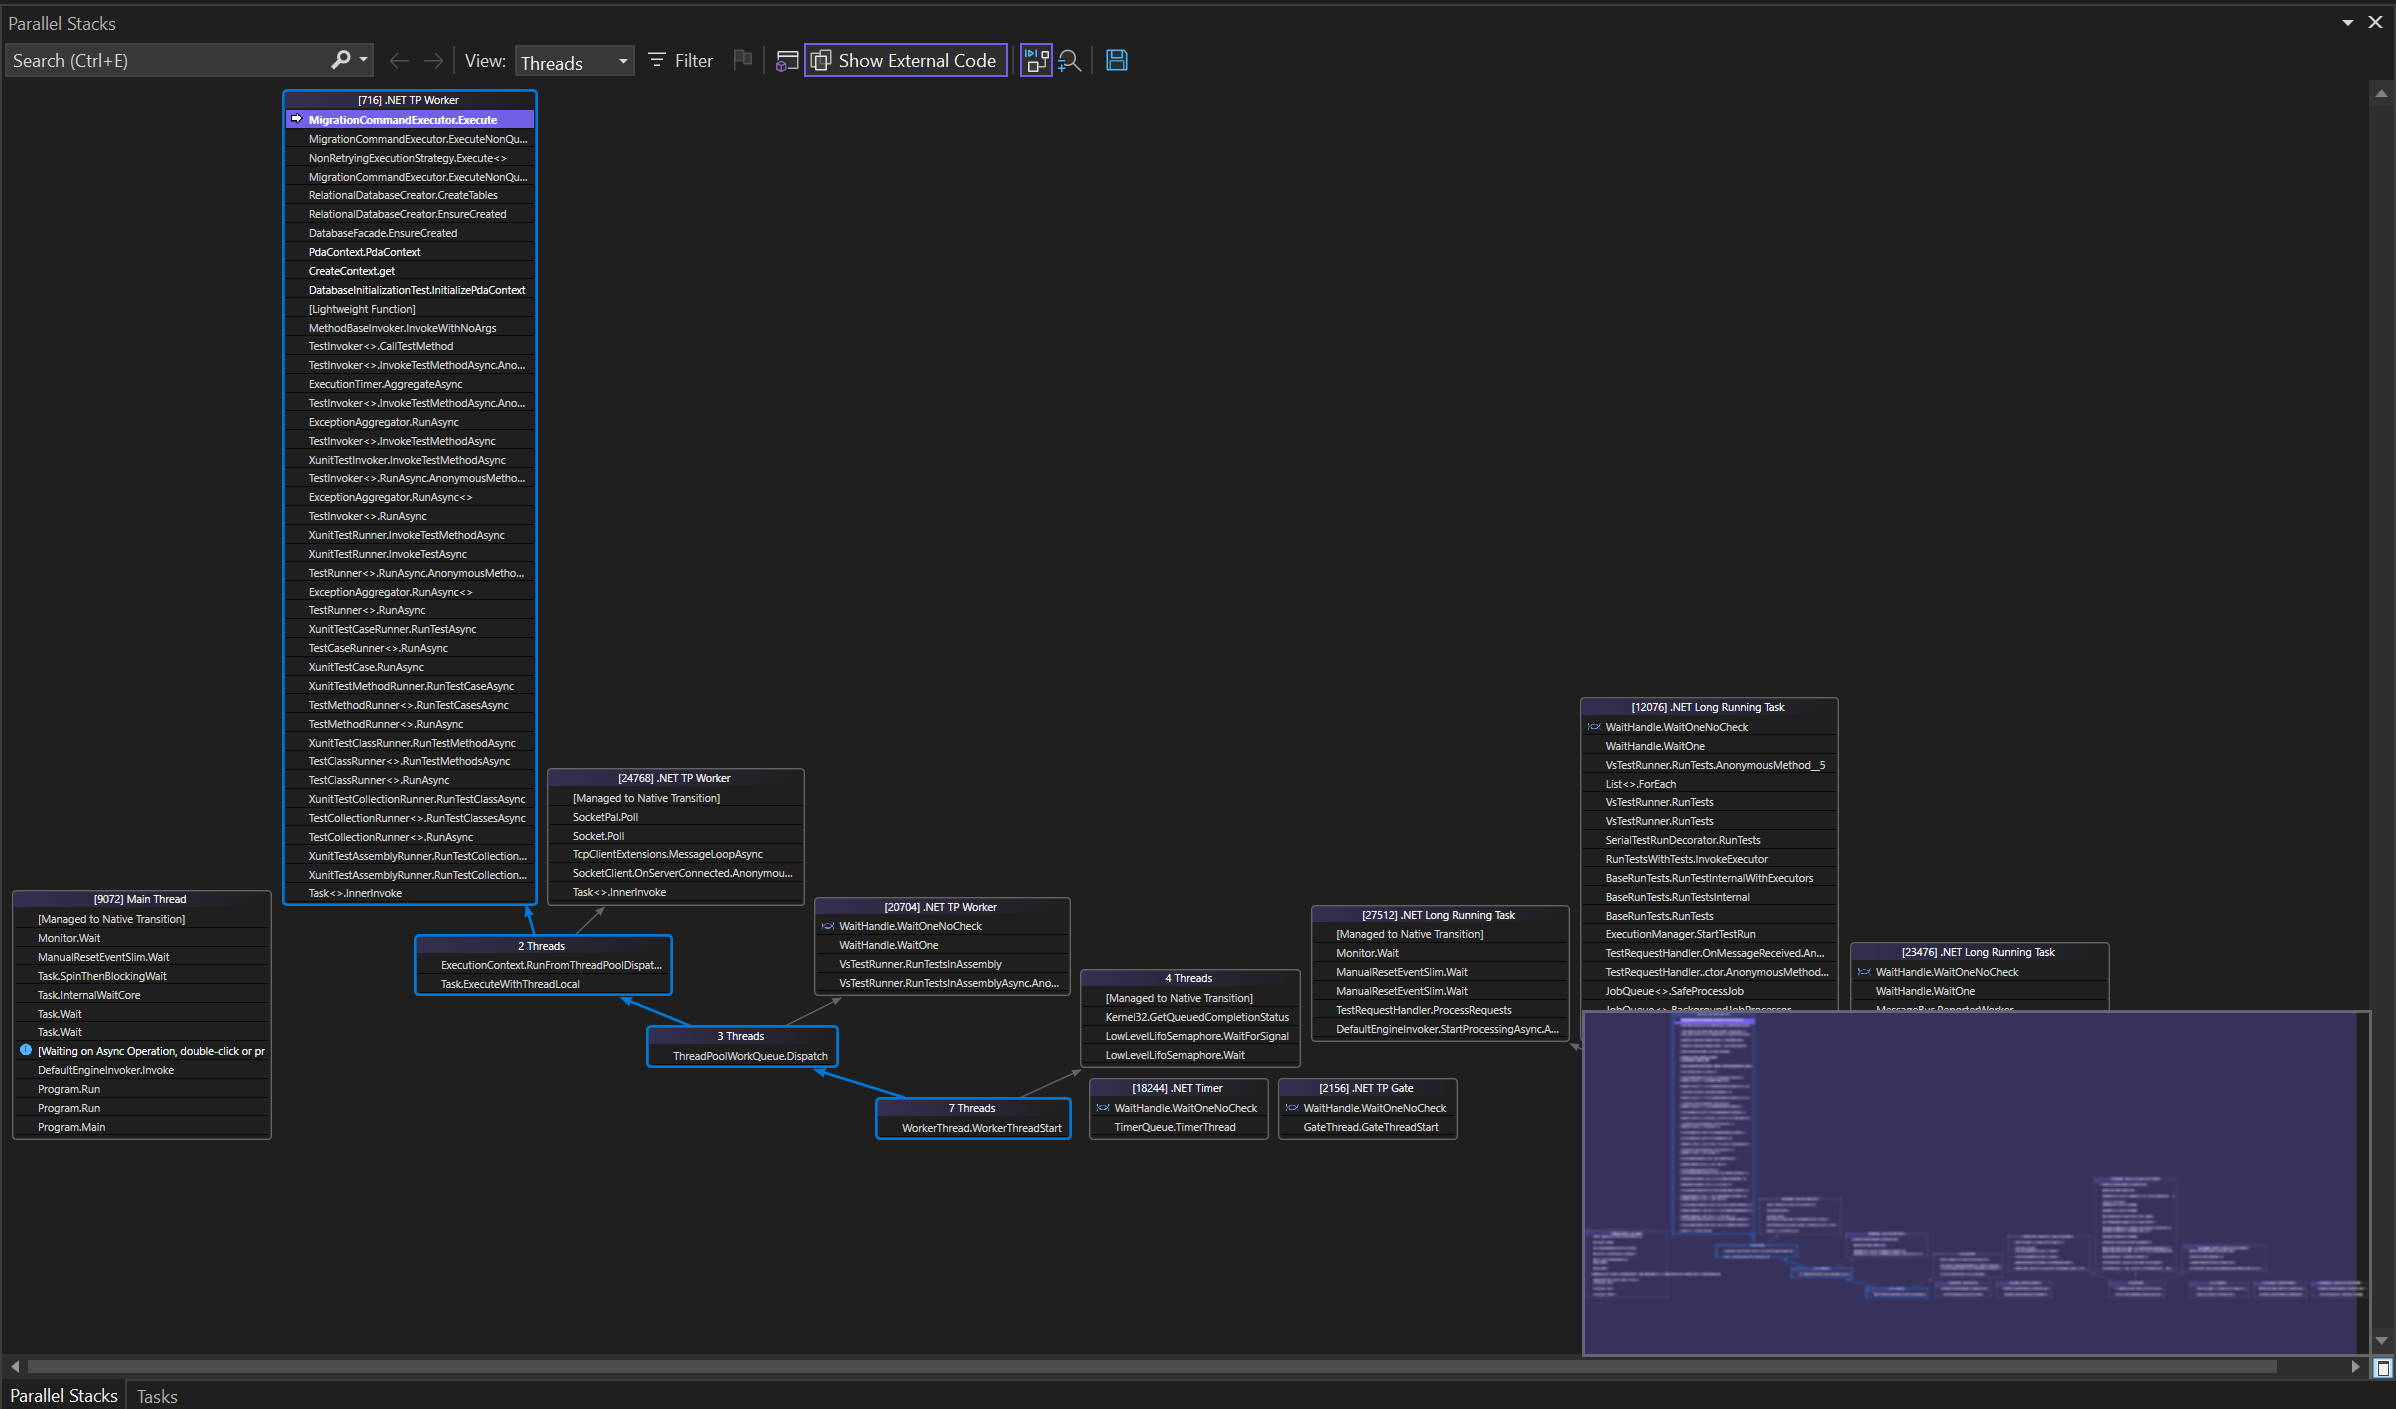
Clicking these stacks allow you to directly navigate to the stack on the given thread. Navigating to a different thread causes your debugger to be pointed at a different instruction, and shows a different call stack as relevant for the current instruction the debugger is paused at. In addition it shows new locals.
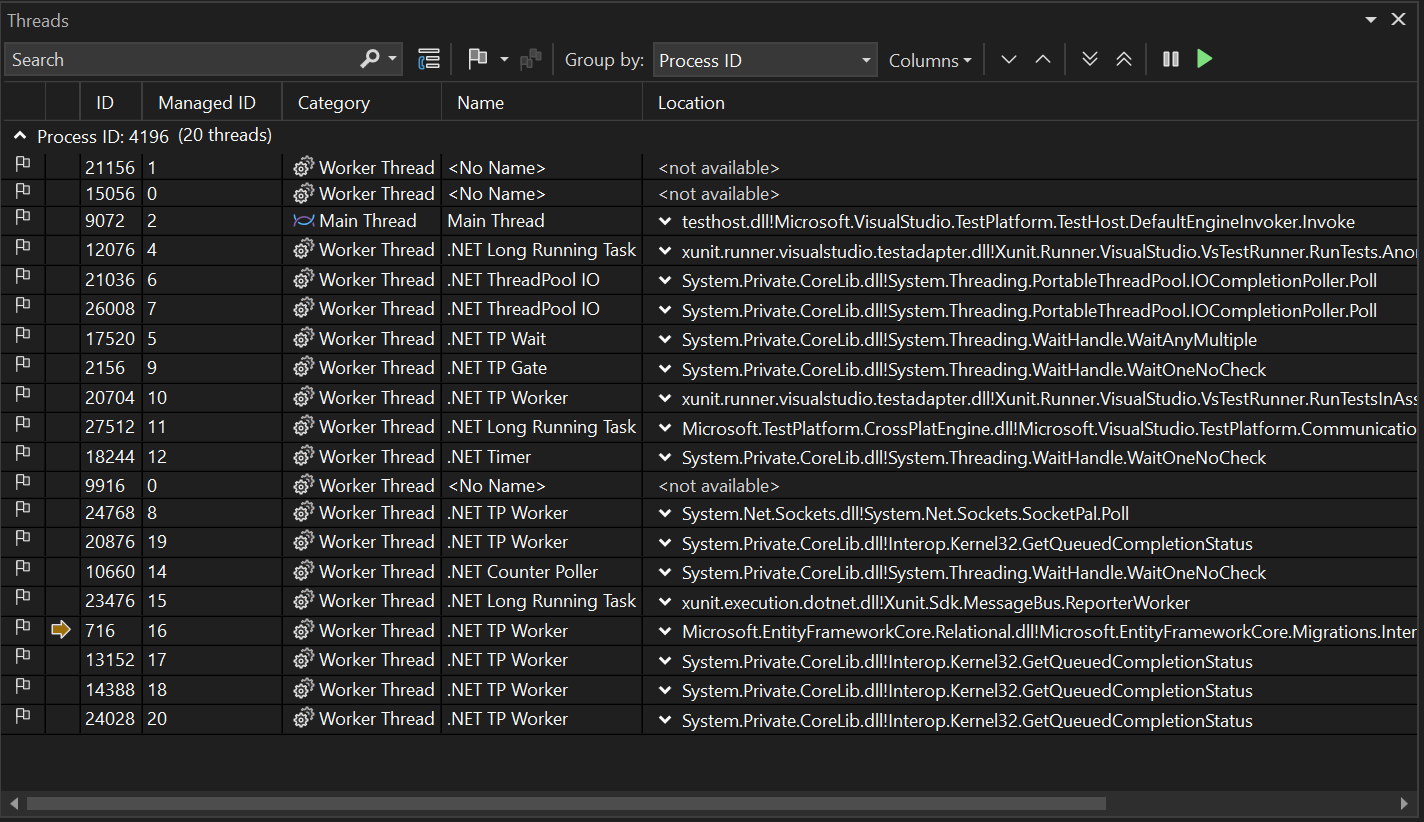
Tasks and Threads Windows
Depending on your multithreading model you might want to use the Tasks and/or Threads windows. Navigation works the same as with the Parallel Stack window.
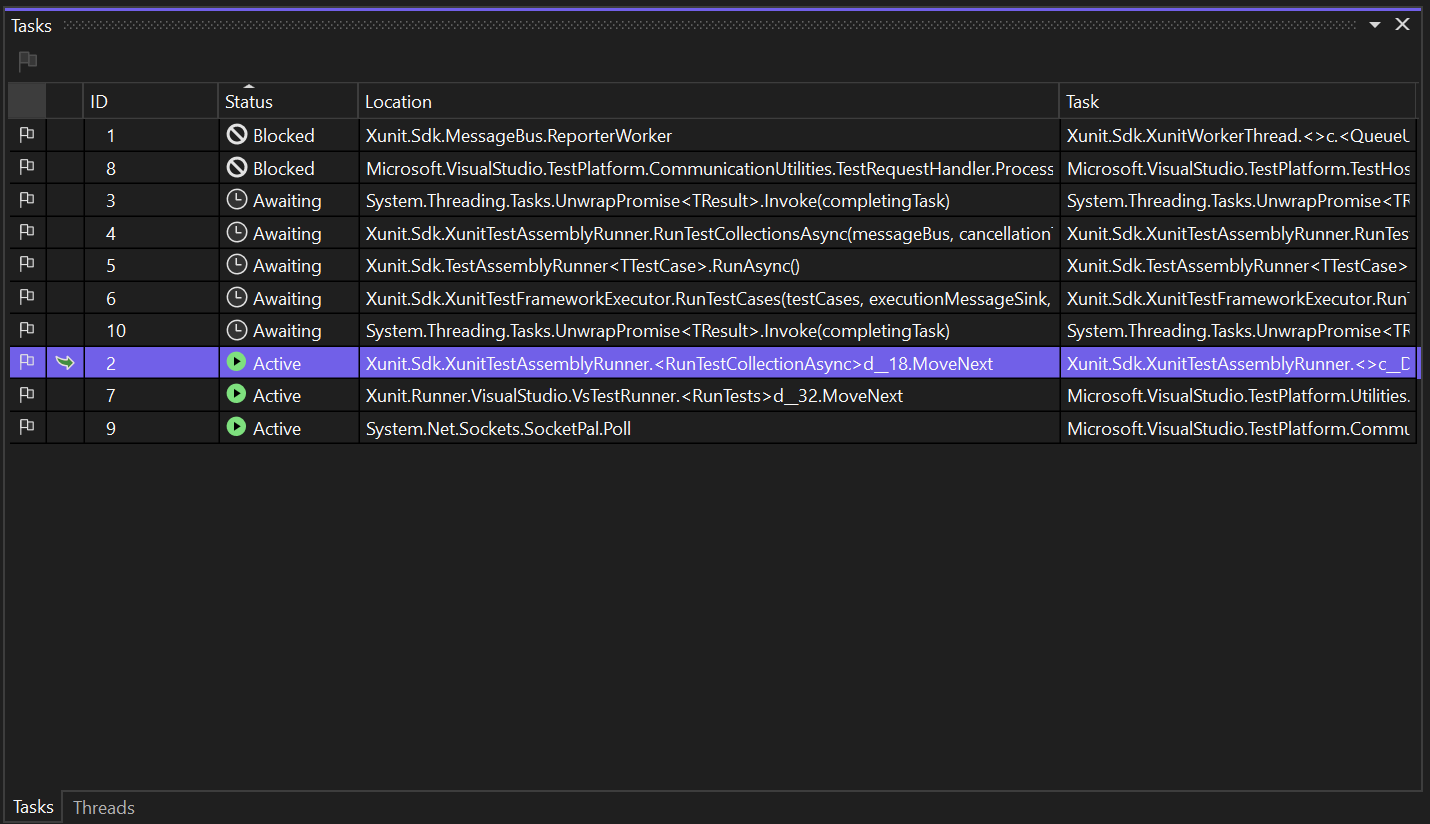
From both of these windows it is possilbe to freeze and thaw associated threads for more fine-graned control of runtime behaviour. It’s doubtful if you want to find yourself in a situation like this, but if necessary you can do so.
Window Structuring
Visual Studio has a distinct separation between development and debug windows. Personally I am using this to my advantage during debugging sessions by creating a separate debug window showing all of this information next to one another, leaving my main window free to read and navigate the codebase. In practice this looks like this:
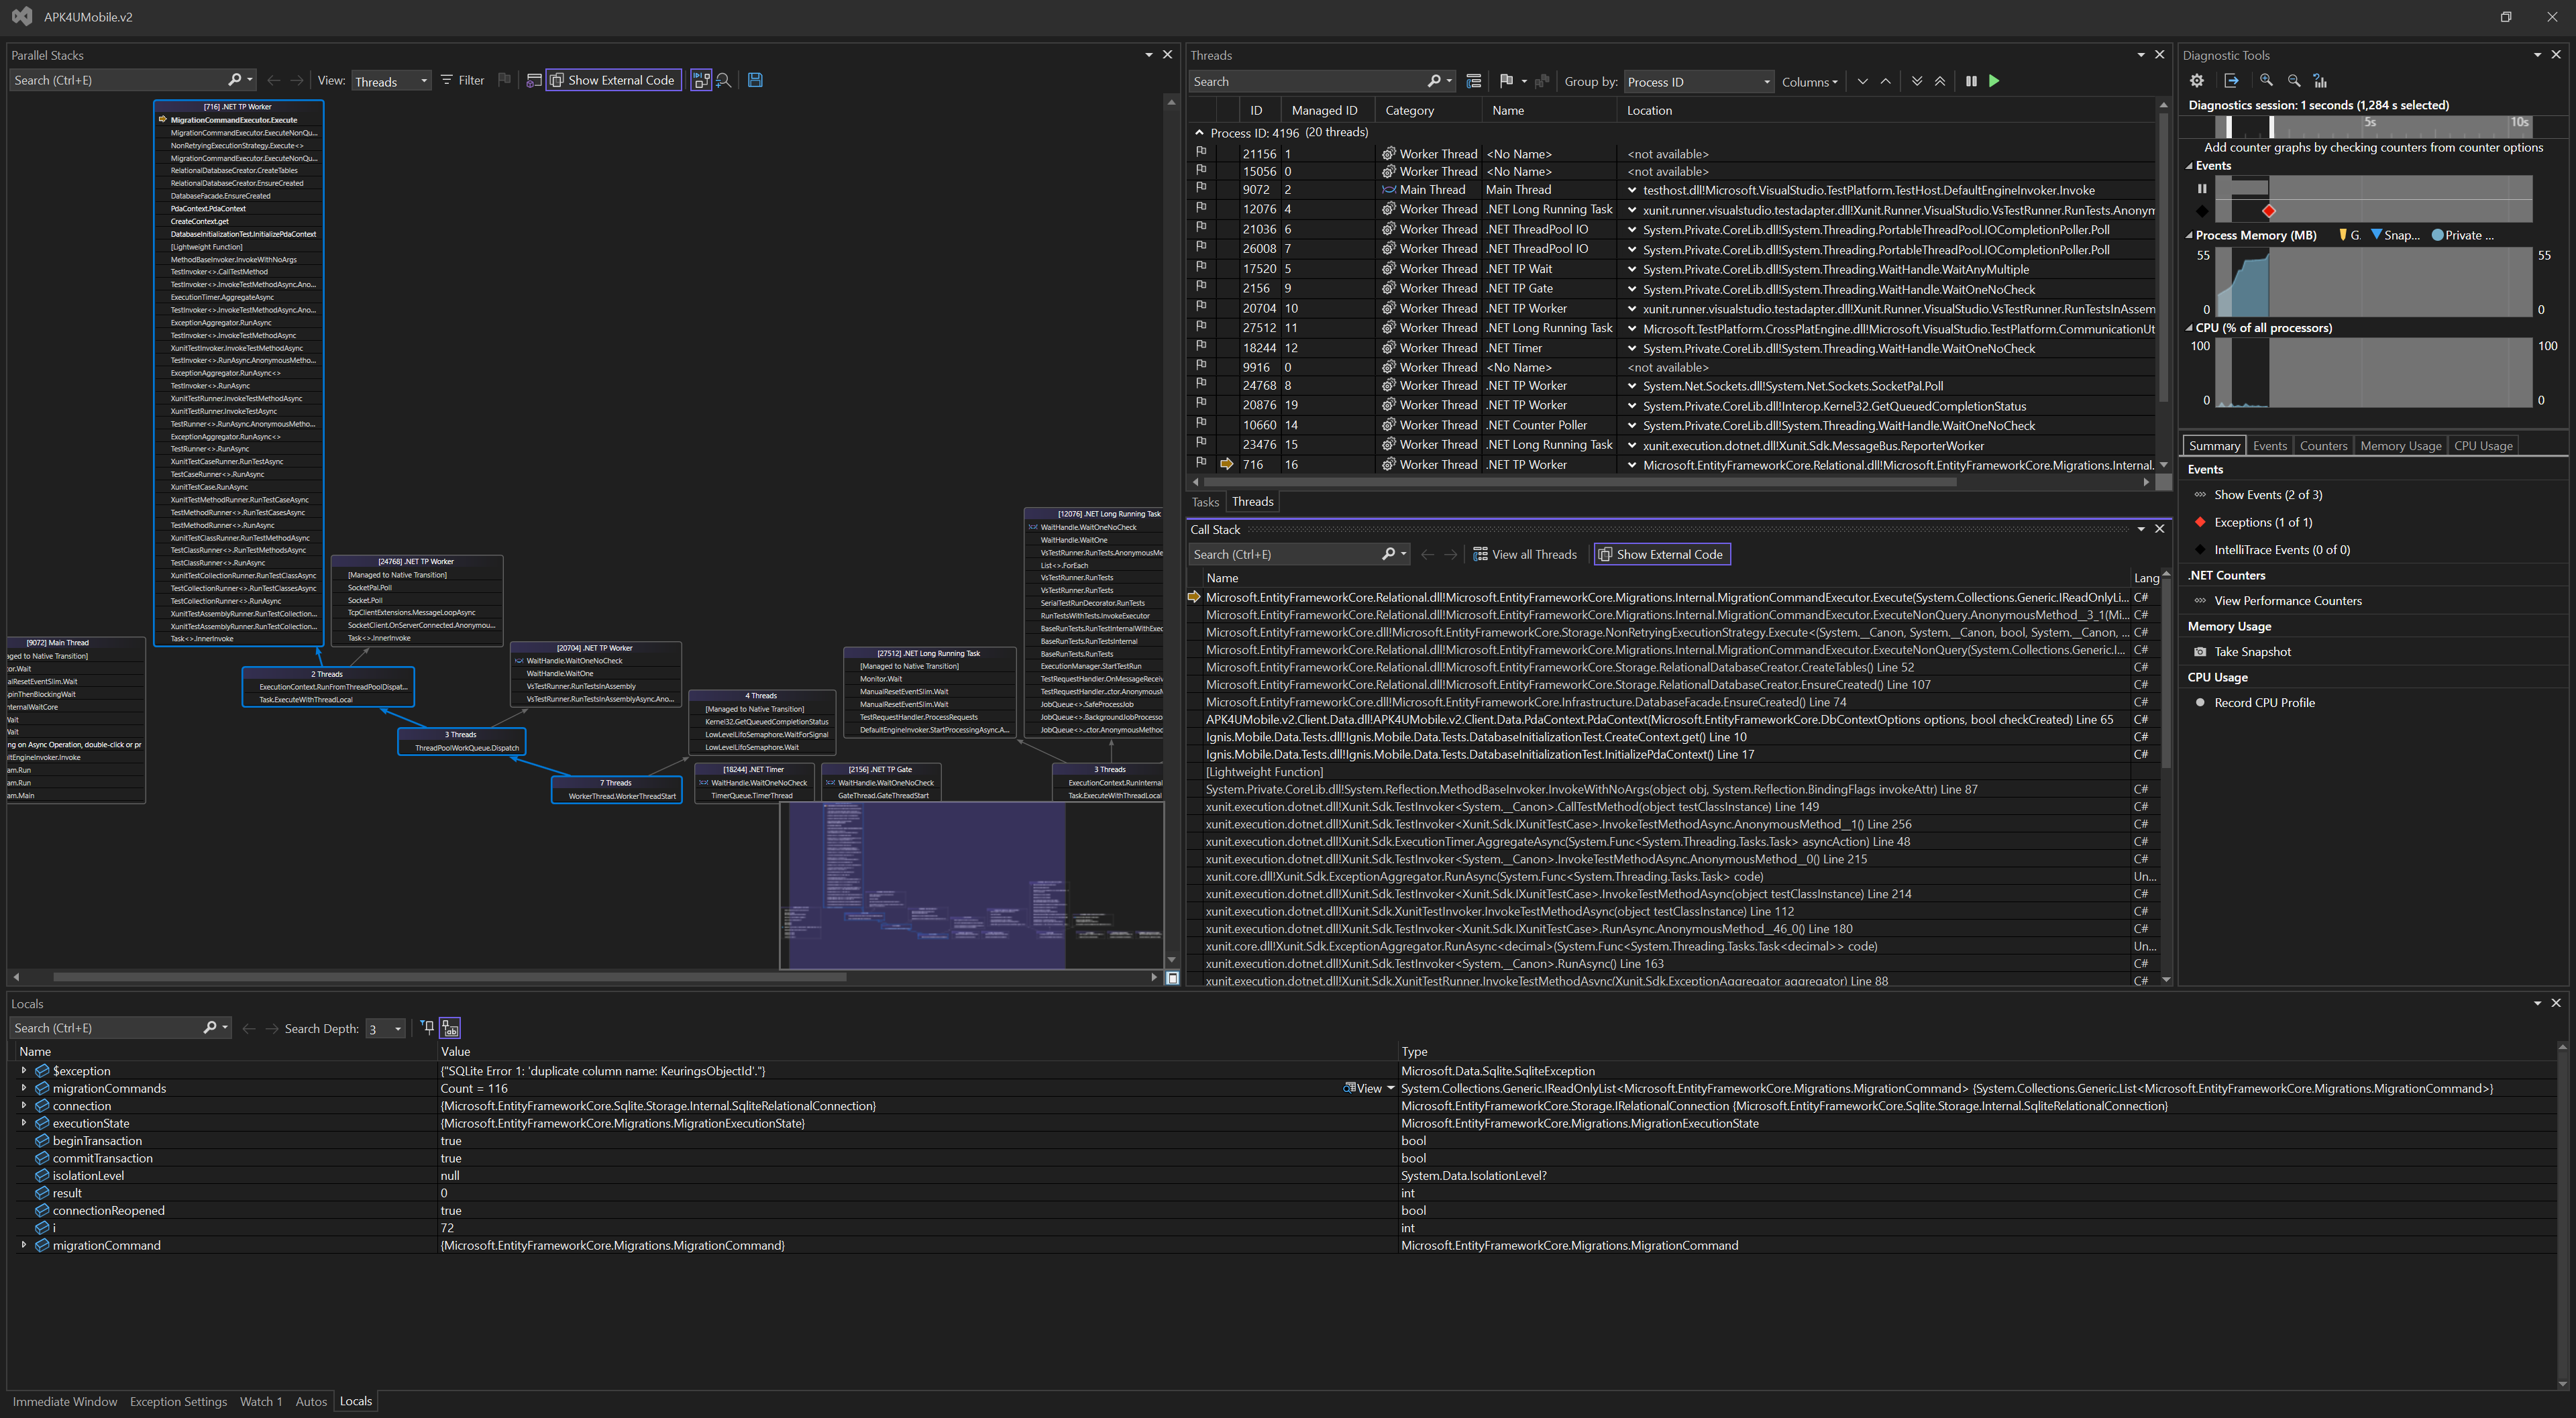
Down to the bottom I maintain an eye on variables; the Watch, Autos, Locals and also quite importantly the Immediate Window. In addition I have the Exception Settings for easy access to exception break configuration.
To the right I have diagnostic tools. While I relied heavily on this window early in my career as developer, it’s significance has dismissed significantly. Every now and then I still use it to create a snapshot, to inspect memory footprint and the likes, though nowadays it’s importance is heavily diminished.
Next ot the diagnostic tools there’s the tasks, and threads, with the callstack tucked underneath. Prominent on the left there’s the parallel stacks window. The parallel stacks is one I personally like as it provides a visually distinct perspective as to where in the current application you are.
Closing Remarks
The main reason for sharing this is the relative obscurity of these incredibly powerful tools. Being able to handle and navigate these tools effectively allow one to go from a painfull multi-hour trial and error session to resolve an error to exactly pinpoint the root cause and work from there. It is able to provide clarity to obscure parts of the codebase we do not really care to know about until we have to.
Much of the recent improvements in my workflow I owe to both the adoption of TDD and getting to know these debugging tools. TDD is there for the isolation and reproduction of failure modes. These debugging tools then help to get to the bottom of them when necessary. Combined these feel like a massive upgrade in overall developer ergonomics.
 Reinhard Lackner
 PurpleJillyscreams ????
 João A. Toledo